Revised Real-time Multivariate MJO Index
This page updates the revised Real-time Multivariate Madden-Julian Oscillation (MJO) index (RMM-r; Liu et al. 2016) every day for research purpose.
About RMM and RMM-r
The Real-time Multivariate MJO index (RMM; Wheeler and Hendon 2004) is composed of the first two principal components of a covariance matrix that combines the daily anomalies of OLR, zonal winds at 850 hPa and 200 hPa (U850 and U200). These anomalies exclude the climatology represented by the long-term mean and the frist three harmonics of the annual cycle, trends and variations at longer than interannual time scales represented by a 120-day retrospective mean, and some synoptic perturbations as the average between 15oS and 15oN. Each field is then normalized by its globally averaged standard deviation (STD) for an even contribution to the RMM. The three STD values are approximately 15.3 W m-2, 1.8 m s-1, and 4.9 m s-1, which over scales the OLR with a substantial power leakage at zonal wavenumbers 2-5.
By using the three STD values of 2 W m-2, 1 m s-1, and 1 m s-1 for normalization, the RMM-r restores most of the leaked power with slight change at other MJO bands.
The RMM is updated by the Bureau of Meteorology, Australia. Dynamical model MJO forecasts are provided by the Climate Prediction Center, National Weather Service, USA.
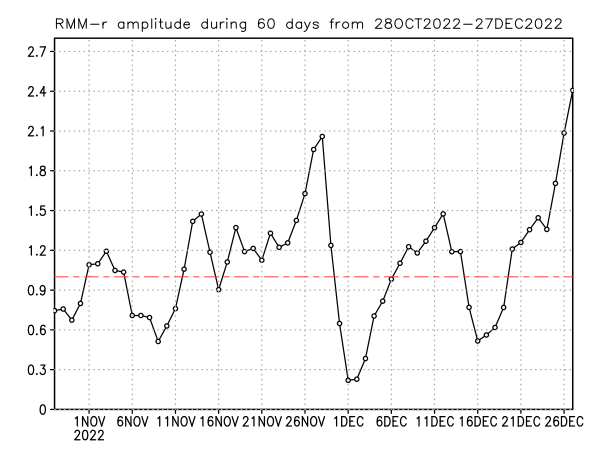
RMM-r Time Series (Data Download)
The RMM1 and RMM2 are based on the OLR from NOAA and the U850 and U200 from the NCEP-NCAR Reanalysis Project. Winds for yesterday are from the Global Data Assimilation System (GDAS) of NOAA. Shown below is the RMM amplitude ( √ RMM12 + RMM22 ) during recent 60 days. The time series in text format from 1 January 1979 to can be downloaded here.
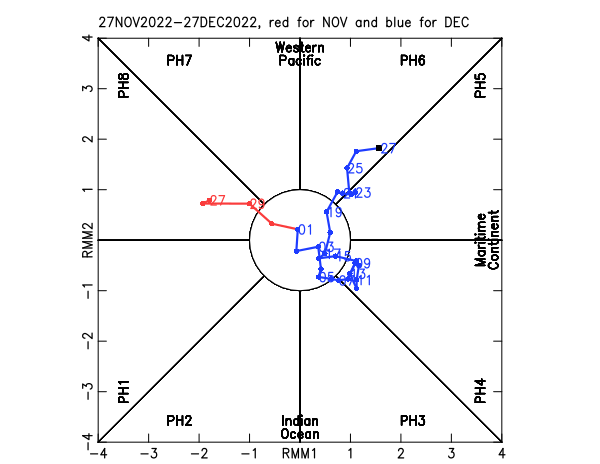
RMM-r Phase Diagram
Points consecutively outside the unit circle record the evolution of a possible MJO event during recent 30 days.
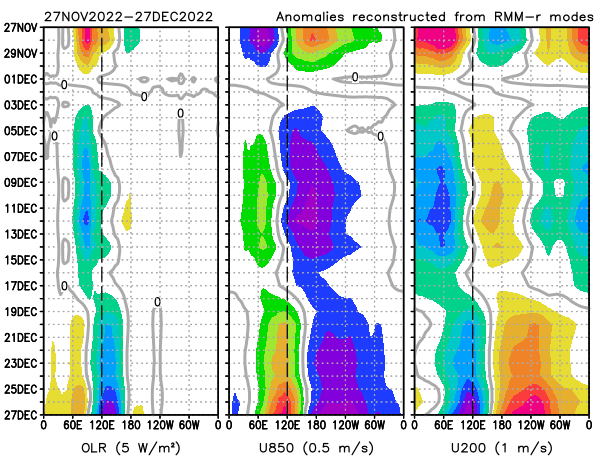
Hovmöller Diagrams of RMM-r Anomalies
The anomalies of OLR, U850, and U200 are reconstructed from the RMM-r modes and their Hovmöller diagrams indicate the evolution of a possible MJO event. Negative (positive) anomalies are the shadings in cold (warm) colors, and zeros are the contours in thick gray. Negative (positive) anomalies in OLR correspond to enhanced (suppressed) convection compared to normal state (climatology described in the 1st part above).